It doesn't have to be. This is how I analyzed our problem to determine if it was a memory leak or performance problem.
First some context:
The application is a Java J2EE web application running on Weblogic and integrating with about a dozen external systems through a variety of middleware platforms. The most dramatic change for this release involves rewriting one of those integrations to support a new and dramatically different version of an external system. This integration is very complicated and heavy on the xml.
So now I know there is a problem, but I don't know how to reproduce it in our environment. This kind of problem could easily be caused by a memory leak. The easiest way to tell if there is a leak is to look at the garbage collection logs.
The gc.log looks something like this:
[INFO ][memory ] 20.407: parallel nursery GC 378204K->202844K (2097152K), 220.715 ms
[INFO ][memory ] 24.512: parallel nursery GC 463356K->266172K (2097152K), 108.514 ms
[INFO ][memory ] 158.352: parallel nursery GC 594933K->397813K (2097152K), 223.864 ms
[INFO ][memory ] 354.614: parallel nursery GC 710277K->554373K (2097152K), 297.761 ms
[INFO ][memory ] 356.632: parallel nursery GC 918935K->772951K (2097152K), 246.615 ms
[INFO ][memory ] 359.976: parallel nursery GC 1121408K->1000192K (2097152K), 254.630 ms
[INFO ][memory ] 362.469: parallel nursery GC 1372915K->1239347K (2097152K), 245.692 ms
[INFO ][memory ] 366.508: parallel nursery GC 1595123K->1468403K (2097152K), 249.064 ms
[INFO ][memory ] 368.933: parallel nursery GC 1824064K->1698240K (2097152K), 240.599 ms
[INFO ][memory ] 371.724: parallel nursery GC 2047811K->2097152K (2097152K), 229.808 ms
While you could look through this file and try to analyze it in your head, I wouldn't recommend it. This is where a visualization tool comes in really handy. I suggest GCViewer (Thanks Andy)
- First delete any lines off the top of the file that don't look like the lines I pasted above. They are interesting to read but will confuse GCViewer.
- Then open the edited gc.log using GCViewer and find a section of the log where the system performing badly. Timestamps are useful for this.

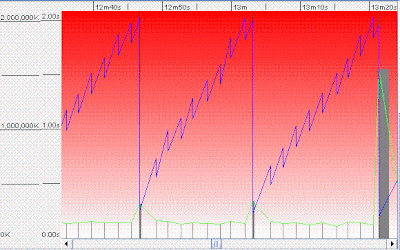
The important things to look at in the graph are:
- The saw tooth lines up. Each "tooth" where the memory usage drops a little represents a partial garbage collection. These partial garbage collections only grab the free memory that is easily available. These collections are fast, but not very effective.
- The dramatic drops represent a full garbage collection. When you run out of memory, your system will do a full garbage collection, which should free up all the space that is available. This garbage collection is much slower, but is much more effective.
- The gray box indicates a system pause for garbage collection. If you see a large gray box like the one on the right of the graph, this is a noticeable pause.
- The amount of memory that is available after a full garbage collection remains approximately constant. This indicates that we are using memory quickly, but releasing it when we are done. If the amount of used memory was increasing after a full collection, that would indicate a memory leak. A leak happens when you hold on to a memory reference when you are done processing instead of releasing it.
In my next post, I'll talk about how I figured out what was using too much memory and how we fixed it.